By Dinesh Kumar · An analysis of official Indian and international data on retail derivatives outcomes
On 11 August 2026, the Minister of State for Finance answered Rajya Sabha Unstarred Question No. 2633 with five years of SEBI data on individual participation and profitability in India’s equity F&O segment. It is the broadest public series of its kind anywhere. This article summarises what it shows, what the closest international datasets show, and where the popular “zero-sum, 90/10” explanation needs correcting.
Download the full 23-page report (PDF) — with every source link, methodology notes and a glossary.
The official Indian data
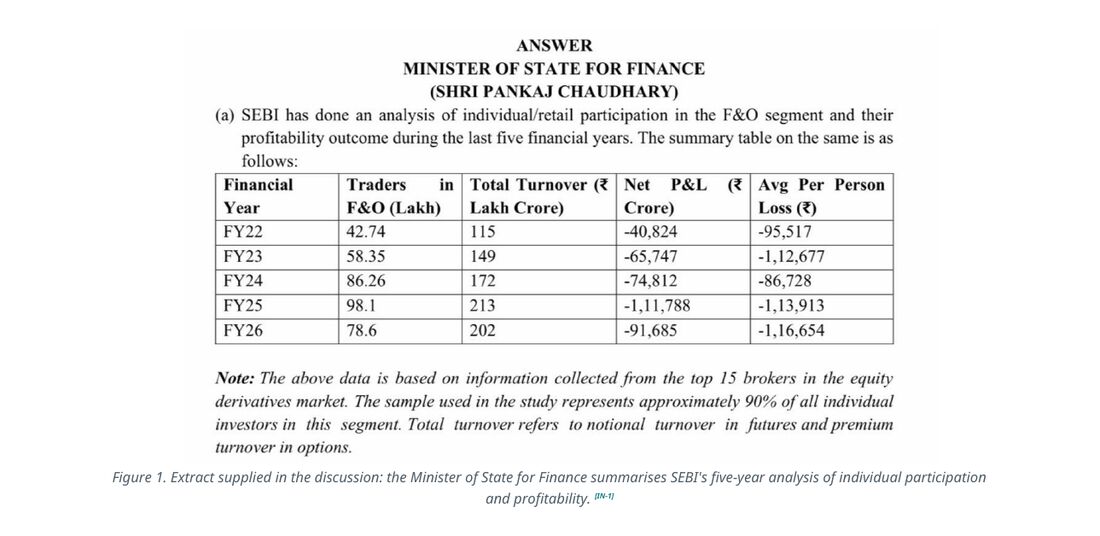
| Financial year | Traders (lakh) | Turnover (₹ lakh crore) | Net P&L (₹ crore) | Average per person (₹) |
|---|---|---|---|---|
| FY22 | 42.74 | 115 | -40,824 | -95,517 |
| FY23 | 58.35 | 149 | -65,747 | -1,12,677 |
| FY24 | 86.26 | 172 | -74,812 | -86,728 |
| FY25 | 98.10 | 213 | -1,11,788 | -1,13,913 |
| FY26 | 78.60 | 202 | -91,685 | -1,16,654 |
The finding most people will miss
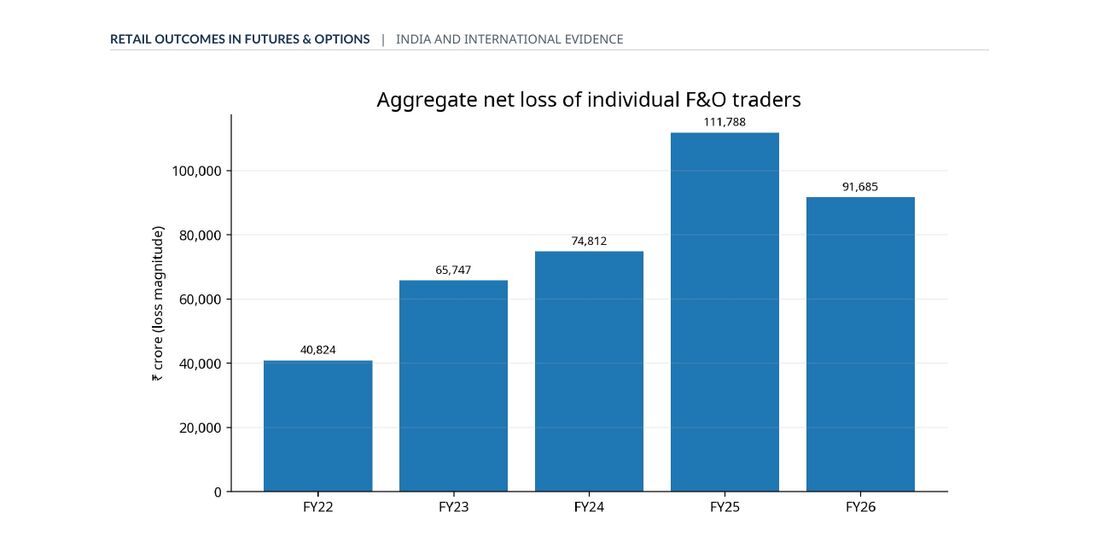
Between FY25 and FY26 the number of sampled individuals fell 19.9% and the aggregate net loss fell 18.0%. On the surface, that reads as improvement.
But the average loss per person rose 2.4%, to ₹1,16,654 — the highest figure in the entire five-year table, and 22.1% above FY22.
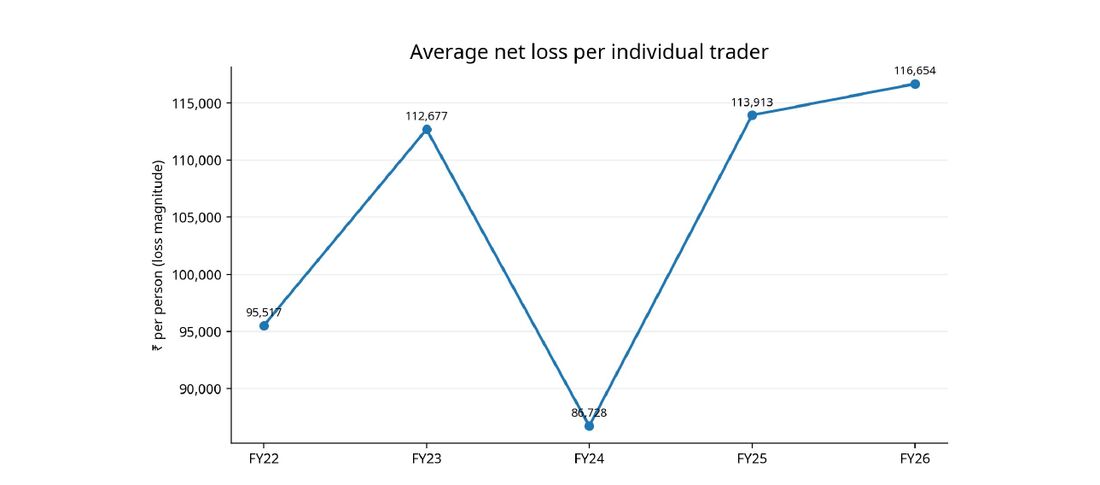
Fewer people are participating, and the average loss among FY26 participants was the highest in the series. A note of precision: the table counts each year’s participants rather than tracking one fixed group, so the correct reading is that FY26’s smaller pool fared worse per head — not that the same identified individuals stayed and lost more. Either way, the aggregate improvement is largely a headcount effect, not an outcome effect.
What earlier SEBI work adds
SEBI’s January 2023 study found that 89% of individual traders lost money in FY22, and that among those who did profit, the top 1% captured about 51% — and the top 5% about 75% — of active profit-makers’ total net profit. Its September 2024 update reported that 93% of more than one crore individual traders lost money over FY22–FY24, with aggregate losses above ₹1.8 lakh crore — and roughly ₹50,000 crore of that going to transaction costs over those three years.
The same parliamentary answer records F&O securities transaction tax collections rising from ₹6,634 crore in FY22 to ₹27,695 crore in FY26, a five-year total of ₹79,966 crore. One scope note: STT is levied on all F&O trades across NSE and BSE, so this covers a broader population than the sampled individual traders above. The point stands regardless — costs leave the customer pool whether a trade wins or loses.
Is this only an Indian problem?
No public series elsewhere matches India on trader count, turnover, aggregate P&L and average loss together. But the closest comparable datasets point the same direction.
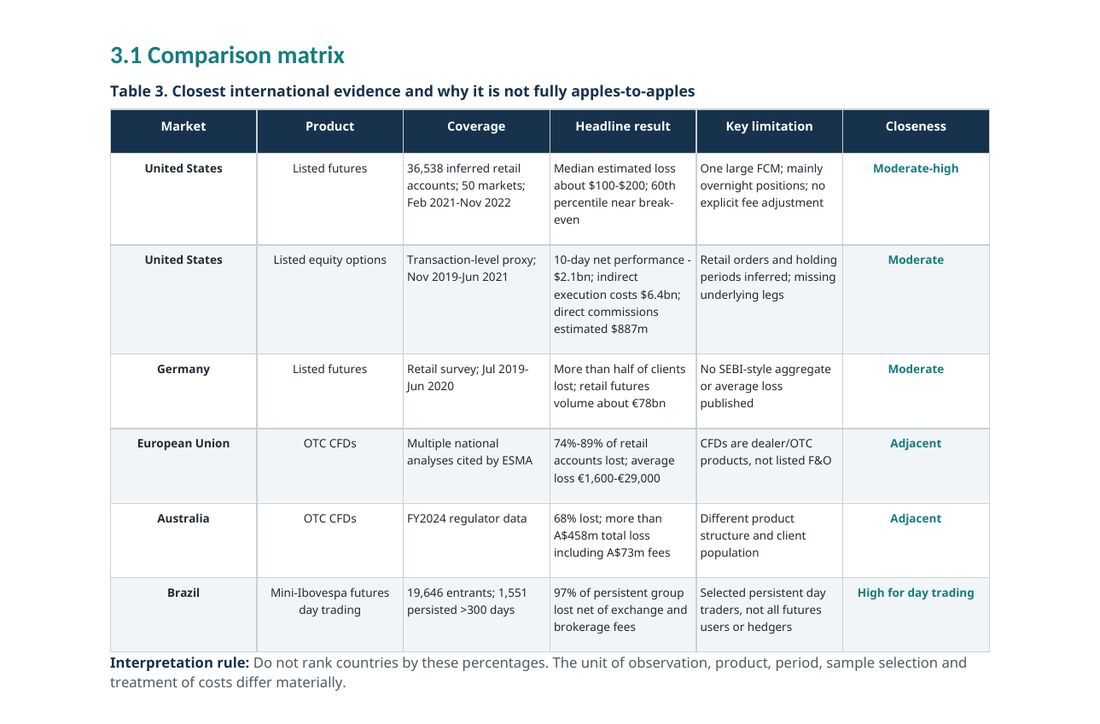
In US listed futures, a CFTC staff study of 36,538 inferred retail accounts — at one large futures commission merchant, observed mainly through end-of-day positions — across 50 markets found a median estimated loss of roughly $100–200, with the 60th percentile near break-even. In US listed equity options between 2019 and 2021, retail trades produced gross performance of about +$4.3 billion, which became net performance of about −$2.1 billion after roughly $6.4 billion of indirect execution costs. Germany’s BaFin found more than half of retail futures clients lost. ESMA reported 74–89% of retail CFD accounts losing across EU jurisdictions; ASIC reported 68% for Australian CFDs in FY2024.
The most sobering is Brazil. Of 19,646 people who began day-trading mini-index futures, 1,551 persisted beyond 300 days. Of that persistent group, 97% lost money net of fees, and only 17 people — 1.1% — earned more than the Brazilian minimum wage. The researchers found no evidence of learning by doing.
These percentages should not be pooled into a single global number. The unit of observation, product, period, sample selection and treatment of costs differ materially between them.
Where the zero-sum argument is right, and where it is not
The familiar claim runs: F&O is a zero-sum product built for hedging; most speculators lose; the losses of roughly 90% become the profits of roughly 10%.
What is correct: before costs, and across the complete set of counterparties, derivative P&L does sum to zero. Every long futures gain is matched by a short futures loss.
First correction — customers are not the complete set. After brokerage, exchange and clearing charges, taxes and other externally paid costs, the combined result of customer accounts is:
Σ customer net P&L = − (externally paid customer costs)
Zero-sum before costs. Negative-sum for customers after them.
Second correction — zero-sum fixes rupees, not headcount. Ten winners at +₹9 against ninety losers at −₹1 sums to zero. So does ninety-nine winners at +₹1 against one loser at −₹99. The roughly nine-in-ten loss rate observed in India is an empirical outcome shaped by leverage, costs, behaviour and unequal capability — not a rule the contract imposes.
Third correction — win rate is not profitability. A seller can win many expiries and remain unprofitable after one severe tail loss. A buyer can lose several small premiums and still profit from one convex payoff. And the trading counterparty on the other side is not simply “the profitable 10%”: it includes proprietary desks, FPIs and market makers. Brokers, exchanges, clearing corporations and the government are not counterparties to the trade at all — they are paid brokerage, charges and taxes on every trade regardless of who wins it.
The practical test
The strongest honest version of the thesis is not that derivatives reserve profit for a fixed elite. It is that unhedged retail speculation is a highly competitive, cost-bearing activity in which the base rate of persistent profitability is poor.
Before treating F&O as a trading business, the report suggests testing: is the position reducing an existing risk or creating a new leveraged bet? What specific, testable reason should this strategy earn positive P&L after every cost? Is that edge demonstrated over a large sample, out of sample, and across different volatility regimes? Have brokerage, spread, slippage, exchange fees, taxes and platform costs all been included? Can the position survive a historically severe move without forced liquidation?
Without objective evidence of a repeatable edge after all costs, the safer assumption is not “I will be in the profitable minority” but “I have not yet shown that I possess an edge.”
Download the full report (PDF, 23 pages)
Primary source: Rajya Sabha Unstarred Question No. 2633, answered 11 August 2026 by the Minister of State for Finance. Additional sources: SEBI studies (January 2023, September 2024), CFTC, BaFin, ESMA, ASIC and peer-reviewed academic research. Full citations in the PDF.
This article is for education only and is not investment advice or a recommendation. Investments in securities markets are subject to market risks. Read all related documents carefully before investing.